Mix it up: How to implement multiple monetization models
Now that you’ve had some time to let the concept of Total Monetization sink in, we want to shift your focus just a bit. In this edition of Subscribed, we’ll talk about the essential groundwork needed to successfully adopt Total Monetization.

Follow the dots: Why a customer-centric world requires a demand-led strategy
But wait, you say! Isn’t it already obvious to all that you have to start with the customer? Yes. But here’s the problem: too many company strategies are still focused on the past, where they push supply instead of monetizing demand.

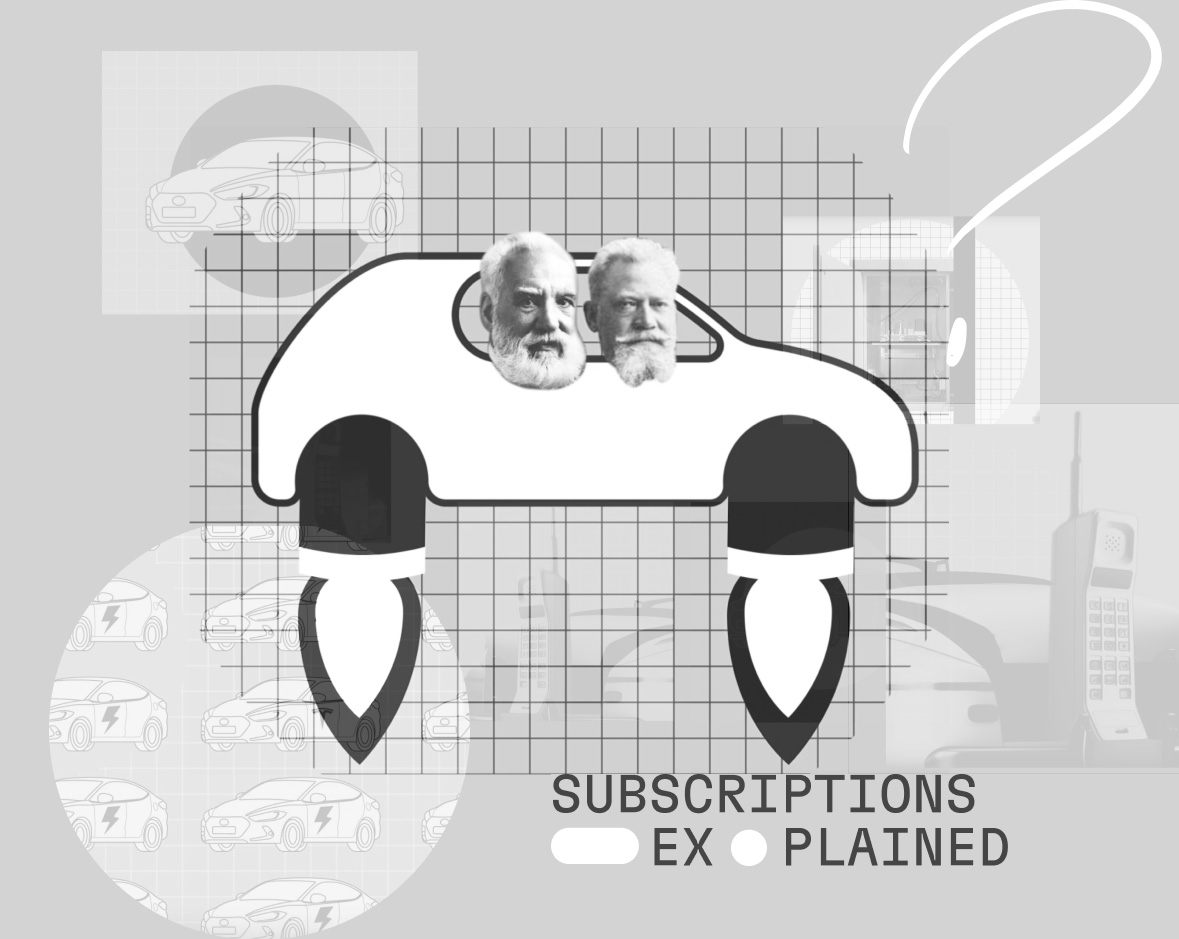
Is the Subscription Economy over? Subscriber fatigue and what it means for modern business
It’s not looking too good for subscriptions right now: News sites are dropping their paywalls, streaming services are turning to ads (and into cable), and there’s even noise of SaaS companies abandoning the model. What’s going on?

Reimagining the Channel Experience for the Subscription Economy
For manufacturers looking to win the channel experience, five key levers can mean the difference between success and failure.

Mix it up: How to implement multiple monetization models
Follow the dots: Why a customer-centric world requires a demand-led strategy
Is the Subscription Economy over? Subscriber fatigue and what it means for modern business
Reimagining the Channel Experience for the Subscription Economy